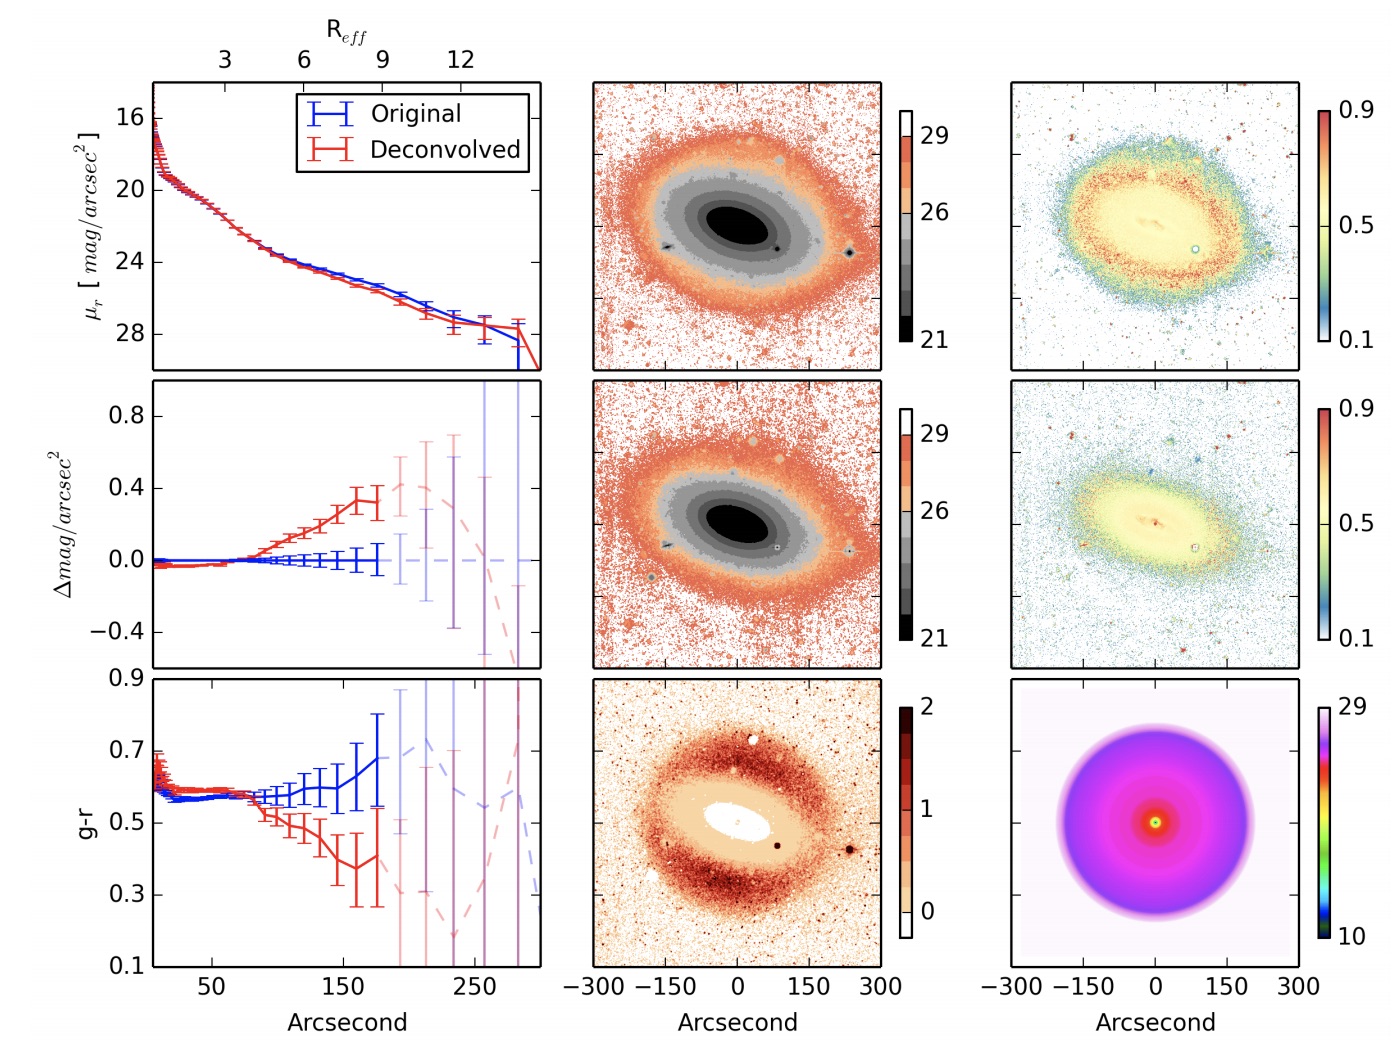
Deconvolution technique applied to NGC 3489. Left column: original and deconvolved galaxy profiles in r band (top), the difference
between the profiles (middle) and original and deconvolved g − r color profiles (bottom) as a function of semi-major axis. Middle column: original
(top) and deconvolved (middle) surface brightness maps in r band, and the difference between the maps (bottom). Right column: original (top) and
deconvolved (middle) g − r color maps and the r-band surface brightness map of the PSF (bottom) that was used for the deconvolution. All maps,
except PSF, were smoothed with a Gaussian kernel of sigma = 0.5500 to enhance the visibility of the faint regions.
(Karabal et al., 2017)