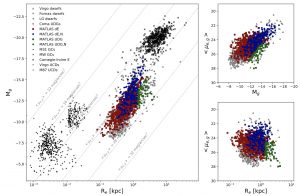
Testing three scaling relations for our dwarf candidates: Mg vs. Re (left), the average surface brightness within Re (⟨μe,g⟩) versus Mg (right, top), and ⟨μe,g⟩ versus Re (right, bottom). The plotted quantities are based on parameters returned by the Galfit modeling, and we have assumed the dwarf candidates are at the same distance as the targeted ETG in the field (the first matching routine in Section 6.2). The nuclei of the dE,N candidates have been masked, and only the properties of the diffuse component of the galaxy are used. Our candidates occupy the same space as dwarf candidates identified in the NGVS (grey triangles; NGVS team, private communication) and NGFS (inverted grey triangles; NGFS team, private communication) images, ultra diffuse galaxies in the Coma cluster (grey pentagons; van Dokkum et al. 2015), as well as Local Group dwarfs (rotated grey triangles; McConnachie 2012). For comparison, we have also included ultra compact dwarfs (black triangles; Zhang et al. 2015; Liu et al. 2015, globular clusters around the Milky Way (black circles; Harris 2010) and Andromeda Peacock et al. 2010, and massive ellipticals from the Carnegie-Irvine catalogue (black x’s; Ho et al. 2011).
(Habas et al., 2019)


