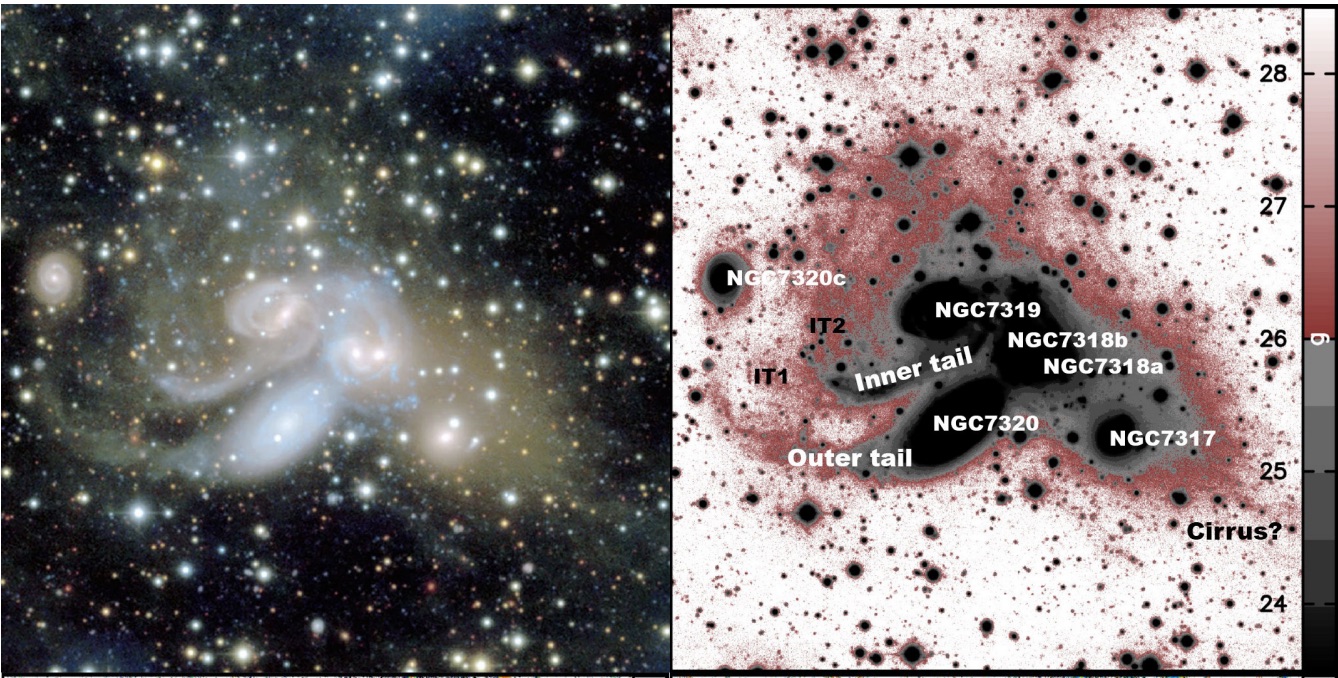
Top left-hand panel: composite u + g + r true colour image of the SQ. Top right-hand panel: g-band surface brightness map, with the principle
structures labelled. The faintest emission (with surface brightness above 26 mag.arcsec−2) revealed by the deep CFHT MegaCam image is shown in red. Bottom
left-hand panel: u − r colour map with HI/VLA map in the velocity range 6475–6755 km s−1 superimposed. The lowest contour is 6× 1019 cm−2 (adapted from
Williams et al. 2002). Selected intergalactic star-forming regions are labelled. Bottom right-hand panel: g − r colour map with archival X-ray/XMM–Newton
contours superimposed. For the surface brightness and colour maps, the scale in mag, respectively, mag arcsec−2 is indicated to the right. The field of view is
10 arcmin × 10 arcmin (250 kpc × 250 kpc). North is up and east left.
(Duc et al., 2018)